Subject:
Analysis and Estimation of Release and Atmospheric Transport of Radioactive Materials Discharged by the Fukushima Dai-ichi NPP Accident
Whats were happened during the Fukushima Dai-ichi Nuclear Power Plant accident in March 2011, and when did each event occur? How did they affect surrounding environment? Their elucidation must bring us fundamentals of a number of our lessons for future improvements and safety. Based on results of various environmental monitoring activities after the accident, we are applying knowledge and results of our study to clarify and understand processes of atmospheric dispersion and deposition of radioactive materials released into the atmosphere during the accident.
1. Temporal Variation in Atmospheric Transport
Many researchers are studying how the released radioactive materials traveled by using meteorological data, results of environmental radiation monitoring and calculations with numerical atmospheric dispersion models, such as SPEEDI. We have taken part in this researching activity.
Direct measurements of external radiation dose by radioactivity in air at the time of the accident and internal doses by inhaled one were limited to people who were around the locations where and when the environmental monitoring was implemented. To estimate dose of a person at any place in the affected area, temporal variation in spacial distribution of atmospheric radioactivity should be elucidated to be related to movement of the person during the accident. The atmospheric transport calculations are applied to reproduce the travel of radioactivity.
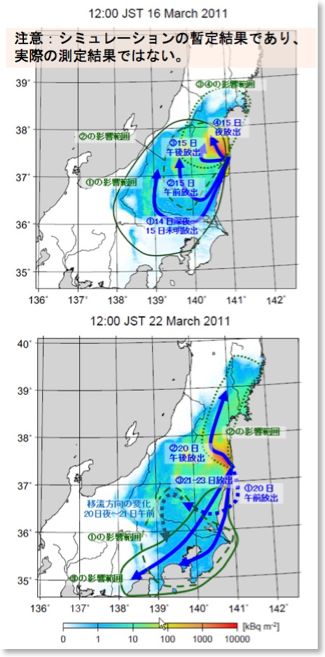
Fig. 1 The estimation of the main routes of radioactive materials released into the atmosphere during the early stage of the Fukushima Dai-ichi NPP accident (modified from the original of the figure published in the Asahi Shimbun on 11 Aug. 2011).
(Top pane) Estimated dispersion routes of radioactivity released for each period in 15 Mar. 2011 (arrows) and area of the deposition (enclosed with curves). Color contour shows calculated cumulative deposition of cesium-137 from 12 Mar. to the noon of 16 Mar. (JST). The input data of release rate is based on Chino et al. (2011), with our modification.
(Bottom pane) For the radioactivity released by 23 Mar. 2011. The color contour is for cumulative cesium-137 deposition from 12 Mar. to 22 Mar. 2011.
>> Enlarge Figs.
2. Time Series of the Release Rate of Radioactivity
During the accident, when, and how much was each radionuclide released from the NPP site? The information of the release rate (“source term”) is fundermantel of any analysis for such as progress of the accident and radiation dose of the public. Checking the source term estimation with different data as well as the ones published by the authorities and with different methods ensures more accurate estimation of the release rate. We have applied newly obtained environmental data to the estimation.
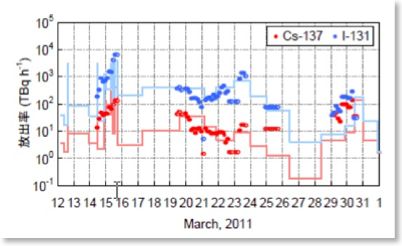
Fig. 2 The estimation of the release rates of cesium-137 and iodine-131 during the Fukushima Dai-ichi NPP accident. Our estimations (dots) are based on measurements of atmospheric concentrations in Kanto region and depositions in Kanto and Tohoku regions. The lines are the estimation by researchers in JAEA and based on atmospheric concentrations and air absorbed dose rates in Fukushima Pref. and Ibaraki Pref. (Chino et al. 2011), which are the scientific ground of the estimated release rate published by Japanese government.
3. Deposition Processes
The radioactivity in the atmosphere finally formed the distributions of dose rate and radioactivity concentrations on the ground though wet deposition (rainfall, snowfall or fog) and dry deposition processes (direct attachment or absorption onto objects on the ground). The radioactivity that remained in air was transported to downwind. These deposition processes are controlled by complicated factors and conditions. Therefore, precise and quantitative predictions/estimations have been hardly achieved. We study them to minimize their uncertainty.
>> back